Understanding Time to Convert Mode in Funnels
To determine how long it takes users to move between steps in a Funnel, you can use the Time to Convert mode in Kubit. Here’s how it works:
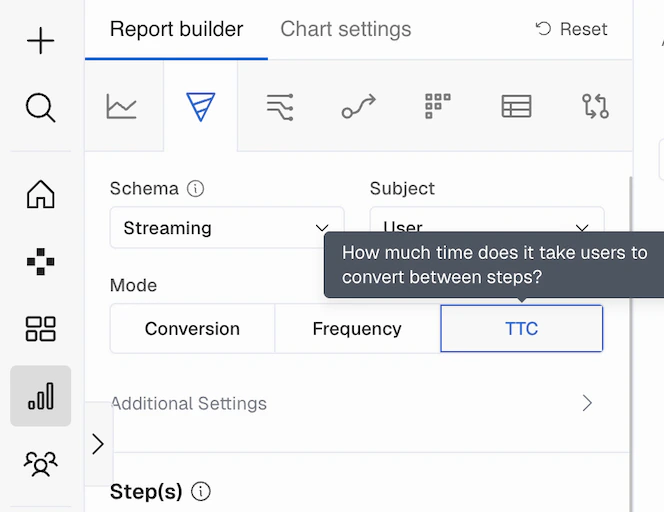
Time to Convert mode, the resulting chart provides insights into:
- The average time users spend on a specific step before moving to the next.
- The percentage of users who take a certain amount of time to convert to the next step.
Bucketing
Kubit generates up to 60 buckets on the chart based on theConversion Window length. The possible bucket lengths are:
- Seconds: 1, 2, 3, 5, 10, 15, 20, 30, 45
- Minutes: 1, 2, 3, 5, 10, 15, 20, 30, 45
- Hours: 1, 2, 3, 6, 12, 18
- A 1-hour
Conversion Windowis divided into 60 buckets of 1-minute each. - A 2-hour
Conversion Windowis divided into 60 buckets of 2-minutes each. - A 6-hour
Conversion Windowis divided into 60 buckets of 10-minutes each.
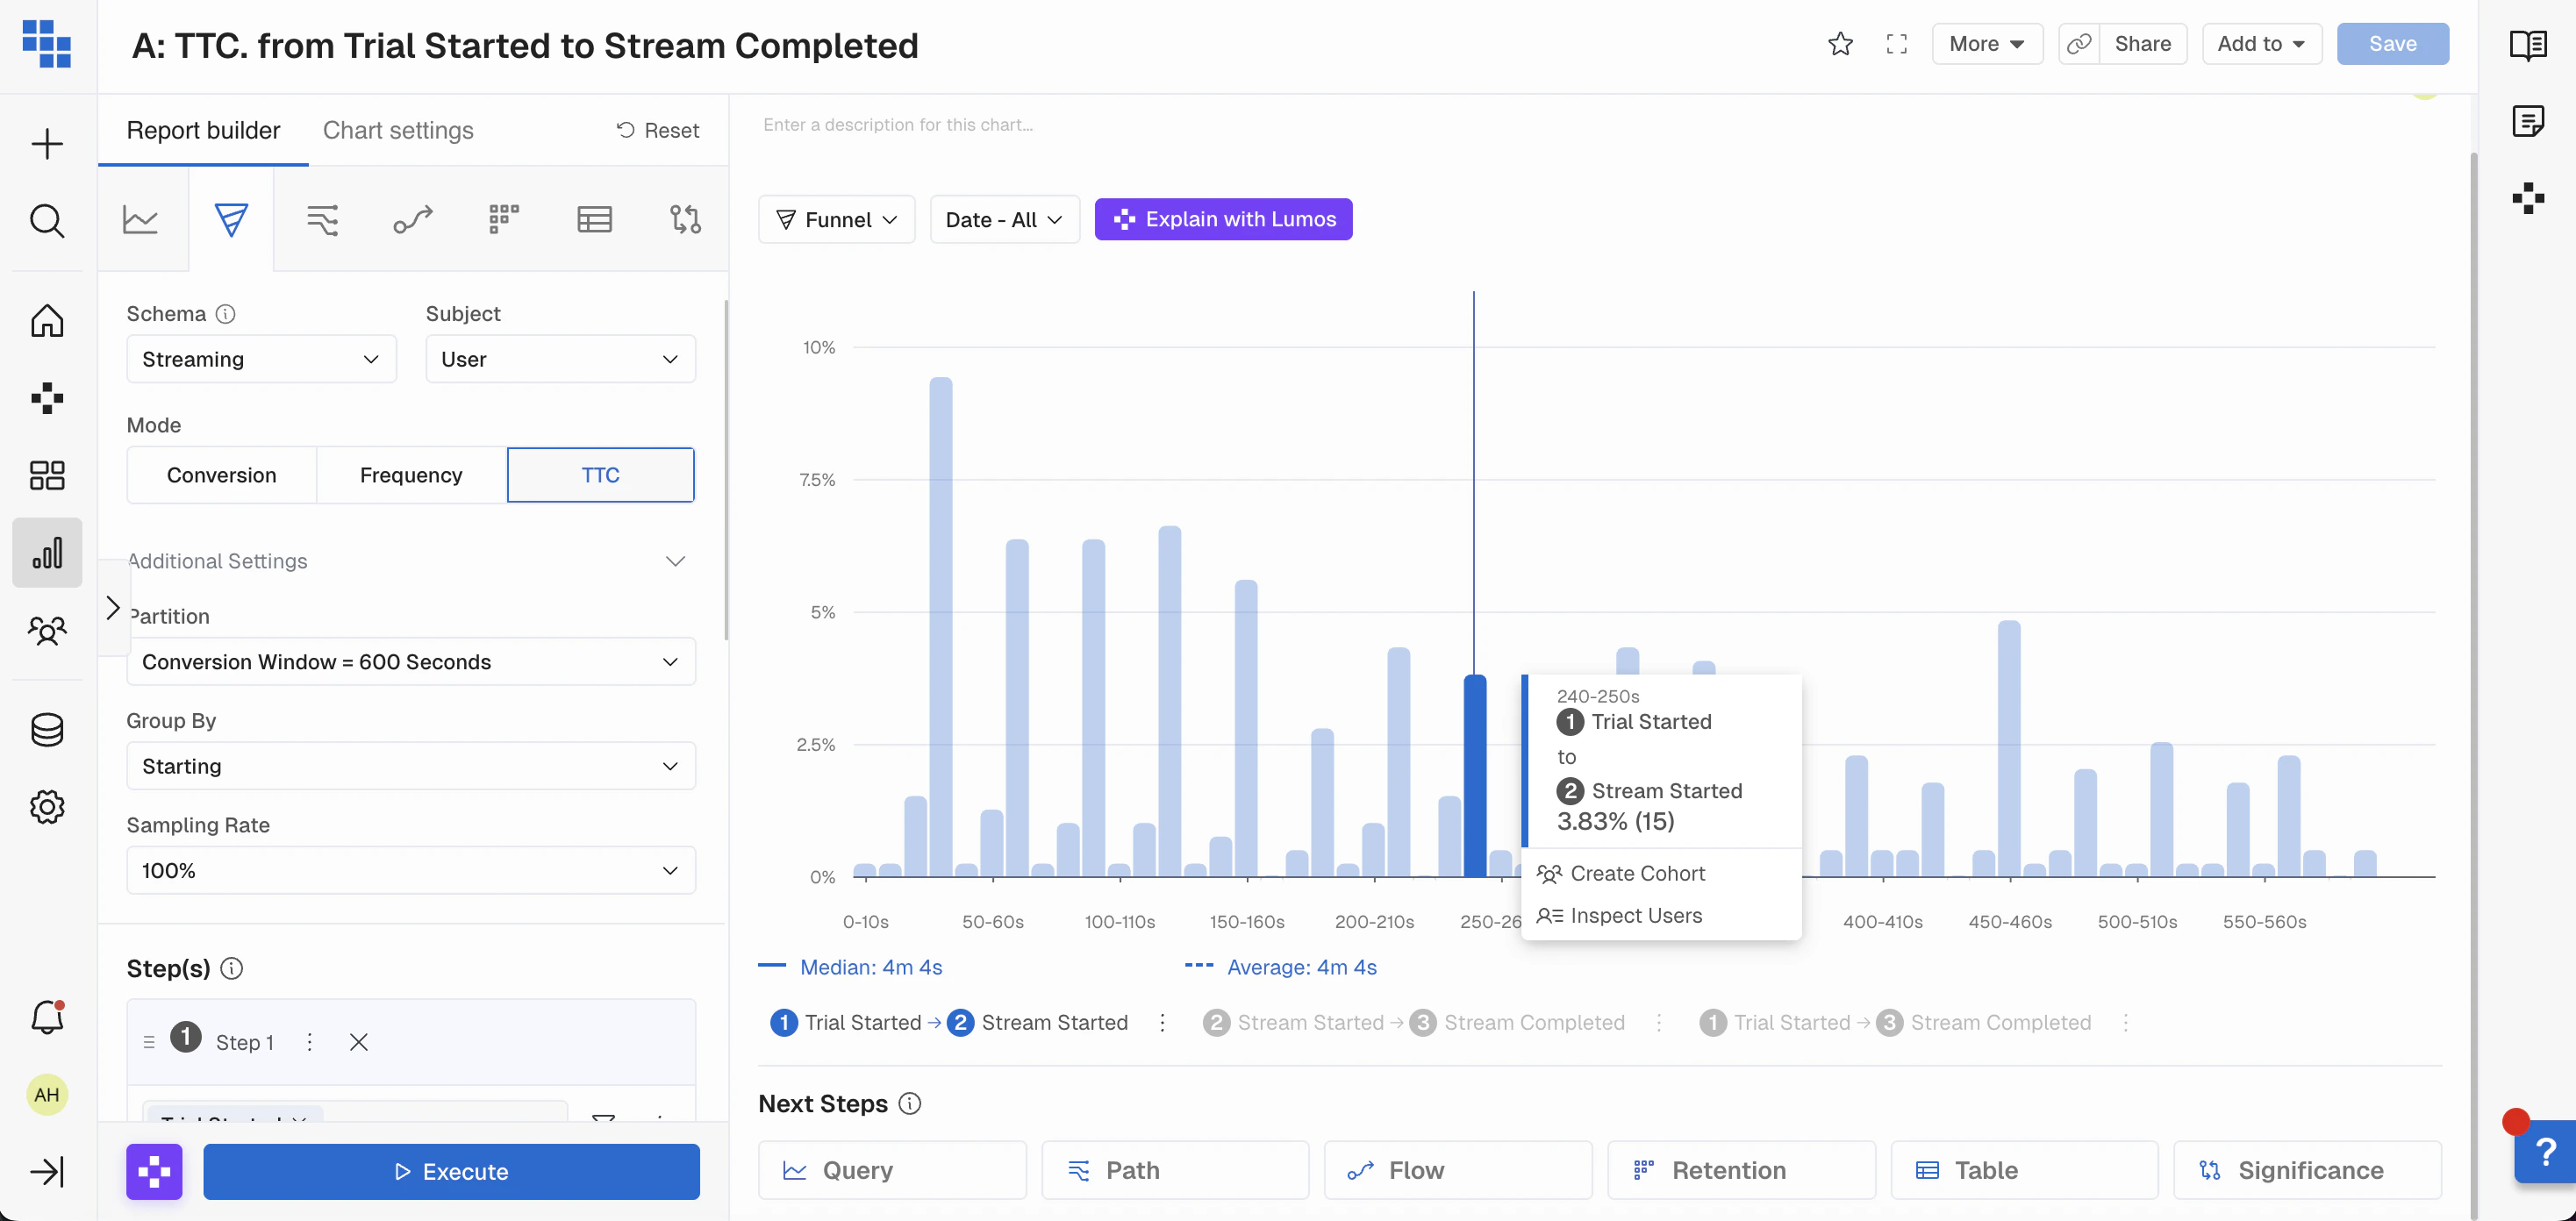
Conversion Window of 600 seconds results in 60 buckets, each 10 seconds long:
Tip: You may need to adjust the Conversion Window to find the right granularity. Start with a larger window and narrow it down based on where most conversions occur.
Constraints
There are a few limitations to keep in mind:- Only the
Partition: Conversion Windowis available to ensure timely analysis. It’s limited to 1 day or its equivalent in seconds, minutes, or hours. - You can only view
Time to Convertbetween two consecutive steps or across all steps in the Funnel. Selecting anything else will result in an empty chart.
Frequency Mode in Funnel Flow